
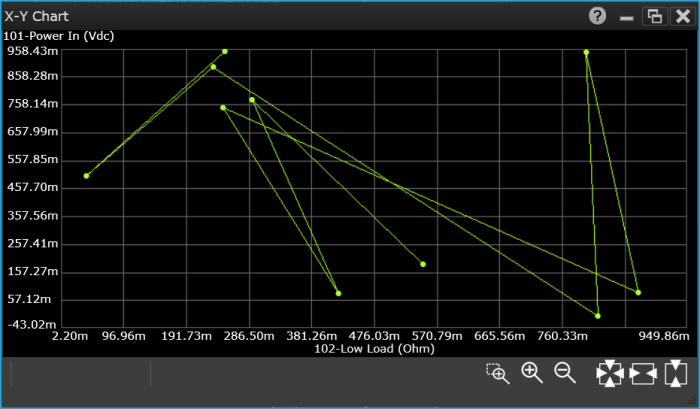
Display scan data as an X-Y chart with two channels plotted on the chart. You can add up to 10 X-Y chart gadgets on the Graphics Setup tab.
Note: This gadget is available in the Scan Module configuration only. If you have selected the Switch Module configuration on the Instrument Settings tab, this gadget will not be allowed for this module.
Select the desired gadget window (the selected window is highlighted in blue) to display the Properties pane on the right side of the Graphics Setup tab. The available properties vary according to the type of gadget selected.
Caption - Enter the desired title to appear at the top of the current gadget window. You can specify a caption with up to 30 characters including letters, numbers, and special characters.
Max Points - Enter the maximum number of data points to be plotted, up to 1,000 points.
Continuous Auto Scale - Click to enable/disable automatic scaling of the x- and y-axis as the scan is plotted.
Connect the Dots - Click to enable/disable a straight-line plot between dots (data points) as the scan is plotted.
Left/Right Y Axis Channel Configuration - For the x- and y-axis, select the desired channel to be plotted (the drop-down list is automatically pre-populated with all channels included in the current scan list). For each axis, you can also specify minimum value, maximum value, and graticule label precision in number of digits to the right of the decimal (0 through 9).
Column Separator - This is a global setting for all gadgets that display data from a scan. Select the desired separator from the drop-down list – tab, comma, or semicolon. Click the Copy Data to Clipboard button to export the data from the current gadget to the Windows clipboard.
Copy Image to Clipboard - Export a screen shot of the selected display gadget to the Windows clipboard.

|
Area zoom. Use the mouse to draw a frame around the desired area of the graph to zoom in on. |

|
Zoom in horizontally. To zoom in vertically only, click on the waveform (waveform turns into a thick line) and zoom in. Click the waveform again to return to the normal zoom mode. |

|
Zoom out horizontally. To zoom out vertically only, click on the waveform (waveform turns into a thick line) and zoom out. Click the waveform again to return to the normal zoom mode. |

|
Auto scale the trace on both the x- and y-axis. |

|
Auto scale the trace on the x-axis. |

|
Auto scale the trace on the y-axis. |
Right-click anywhere on the strip chart to display these options:
Save Chart Image to File - Export a screen shot of the chart to a JPEG, BMP, or PNG file, with a white grid on a black background. By default, the screen shot is stored in the "My Documents" folder on your computer. For example – C:\Users\<user_name>\Documents\Keysight\BenchVue\DAQ\Exports\.
Copy Chart Image to Clipboard - Export a screen shot of the chart to the Windows clipboard.
Copy Data to Clipboard - Export the data from the current gadget to the Windows clipboard with the desired column separator – Tab, Comma, or Semicolon.